

When I sit down with buyers to look at a home in Lynden, Ferndale, Blaine, Birch Bay, or Everson, the photos get all the attention at first. But some of the most useful information is in the small numbers people skim past. Here’s how I read a listing before we talk about an offer.
Days on Market: What the Clock Is (and Isn’t) Telling You
Days on market shows how long a home has been actively listed. A high number doesn’t mean something’s wrong with the house. It may have been priced a little high at first. But it does hint at how much room there may be to talk.
It helps to know what “normal” looks like right now. In September, homes that sold in Ferndale/Custer averaged 57 days on market, up from 41 a year earlier. In Lynden, the average was 90 days, up from 55. Those averages come from a fairly small number of sales each month, so I use them as a rough yardstick, not a rule.
One more thing: a listing that looks brand new may have more history than you’d think. Homes sometimes get taken off the market and relisted. And the Northwest Multiple Listing Service (NWMLS) recently added a “First Look” option that lets sellers market a home for up to 21 days before it goes active. NWMLS says that pre-launch history, including days in status and early price changes, stays in its database, where member brokers and their clients can see it. So ask me for the full history.

Price Cuts: Read the Story, Not Just the Number
A price cut isn’t automatically a bargain, and a home with no cuts isn’t automatically priced right. I look at when the price changed, how big the drop was, and what similar homes nearby have actually sold for since. A home that dropped once and then sat again tells me something different than one that went pending right after a small adjustment.
Sale-to-List: A Helpful Gut Check
Sale-to-list ratio compares what a home finally sold for with its list price. If similar homes have been closing a bit under asking, that shapes how I’d approach an offer. If they’ve been closing right at asking, a lowball could cost you the house. One tip: ask whether the ratio is measured against the original list price or the last one. After a price cut or two, those can look very different. That’s why I pull recent comparable sales for the specific home.
Months of Supply: The Bigger Picture
Months of supply is how long it would take to sell every active listing at the current pace. NWMLS figures it as end-of-month active listings divided by that month’s closed sales. Housing economists typically call five to six months a balanced market. More than that usually gives buyers more choices and time.
In September, months of supply was 5.62 in Blaine/Birch Bay and 7.93 in Lynden. That means you can take a breath, ask questions, and write a thoughtful offer instead of a rushed one.
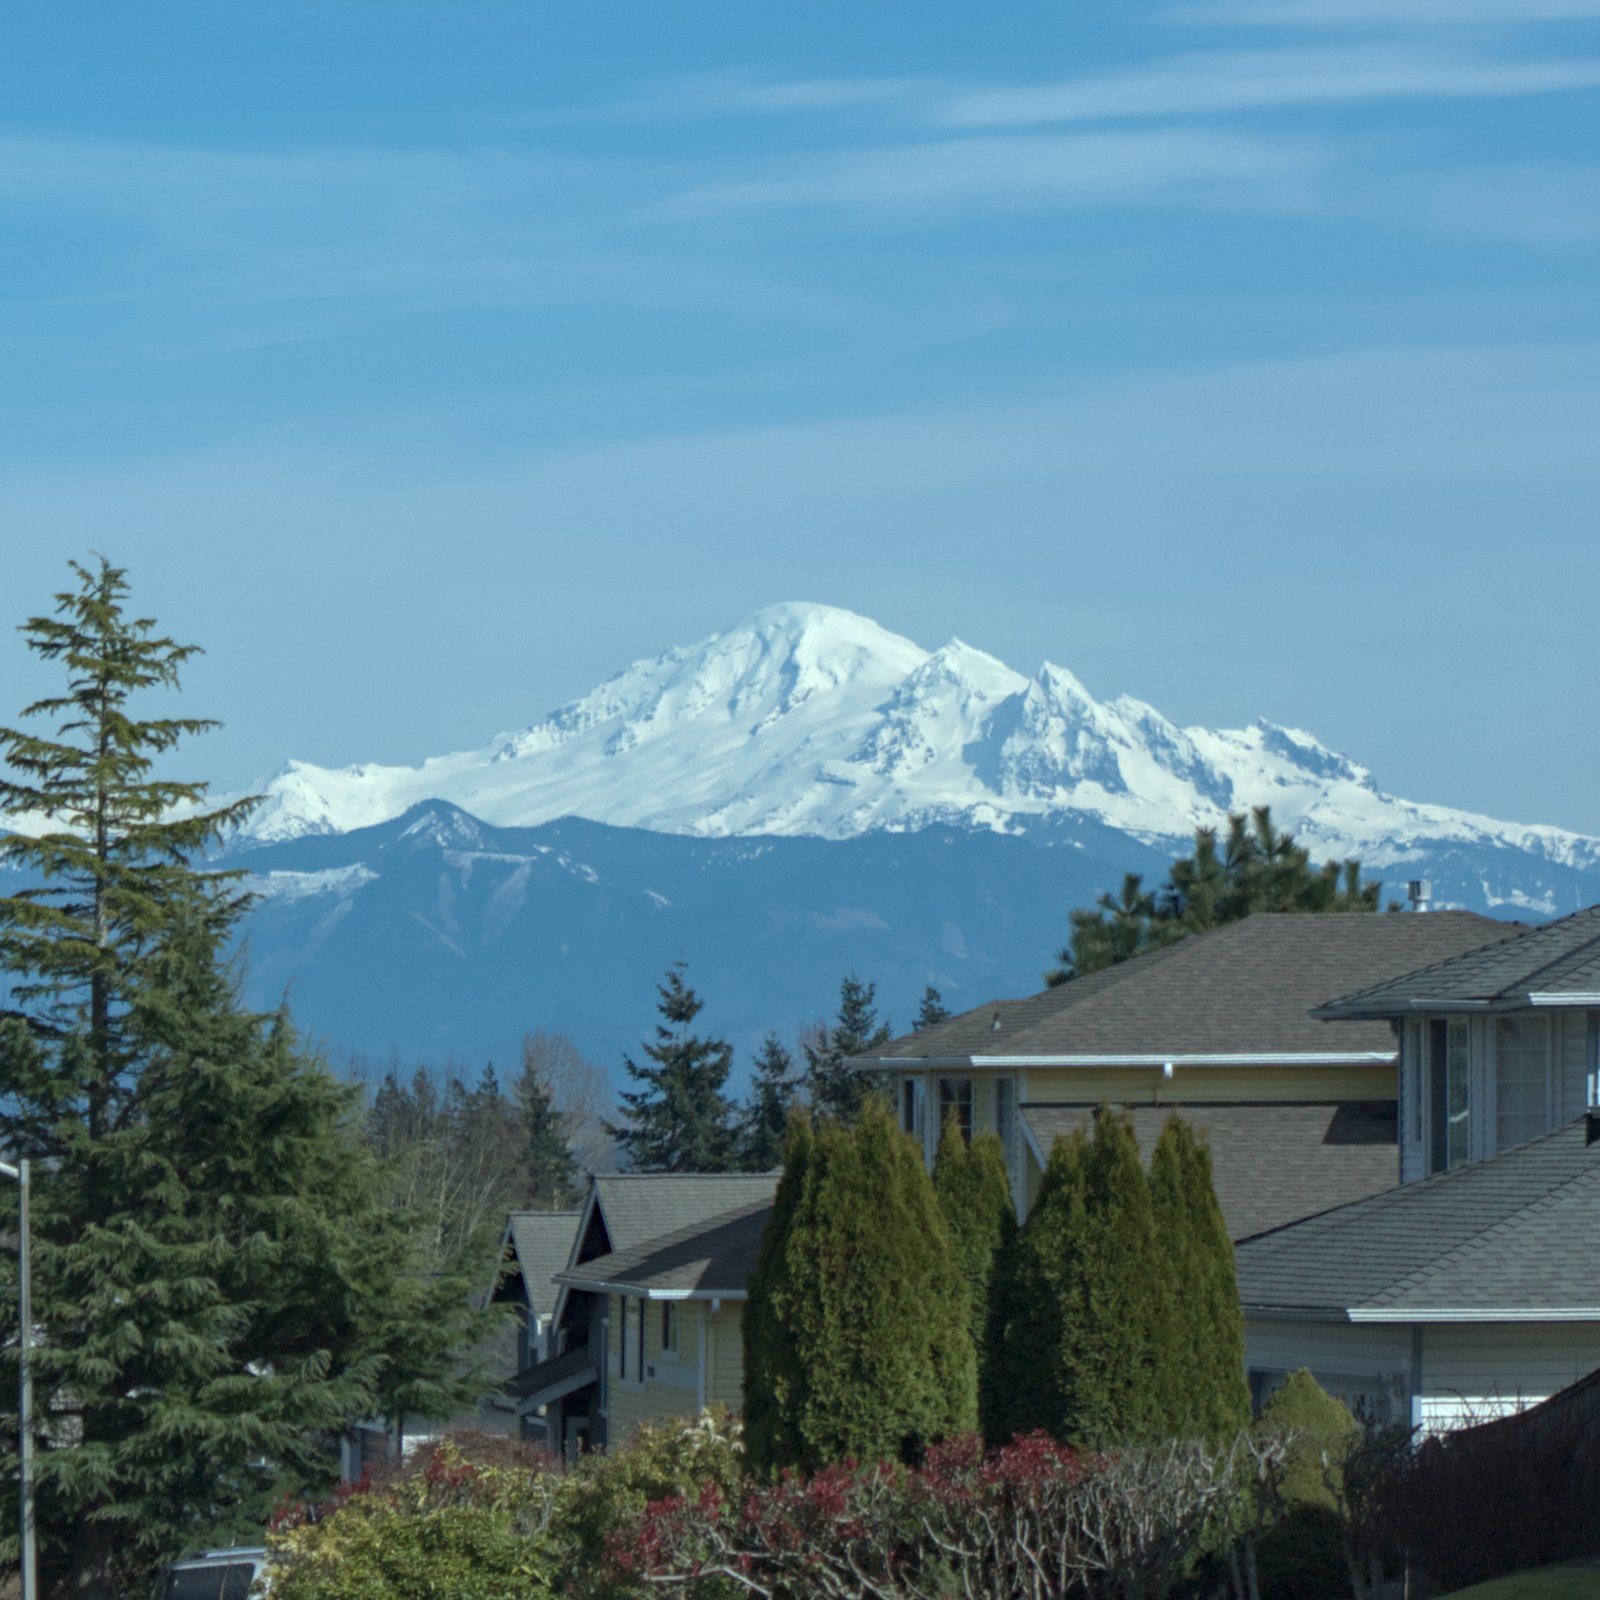 Mount Baker from Ferndale.
Putting It All Together
None of these numbers decides your offer on its own. Together, they help us understand the seller’s position and where there’s room to work, so you can offer with confidence without overpaying.
Found a listing you love, or one that’s been sitting? Reach out to me. I’ll pull its full history and nearby comparable sales, and we’ll talk through a smart offer together.