

How I’d Price a Home This Fall
When I sit down with Lynden sellers this fall, the first thing I tell them is that the market they remember from a year or two ago isn’t the one we’re listing into today. Buyers have a lot more homes to choose from, and homes are taking longer to sell. That doesn’t make this a bad time to sell. It just means the price you launch with matters more than ever.
Inventory: Buyers Have More Choices
At the end of September, Lynden had 111 active homes and condos for sale, up 40.5% from 79 a year earlier (Source: NWMLS). New listings were up too, 35 compared with 24 last September. Pending sales were nearly flat at 19 versus 20, so more homes are competing for about the same number of buyers.
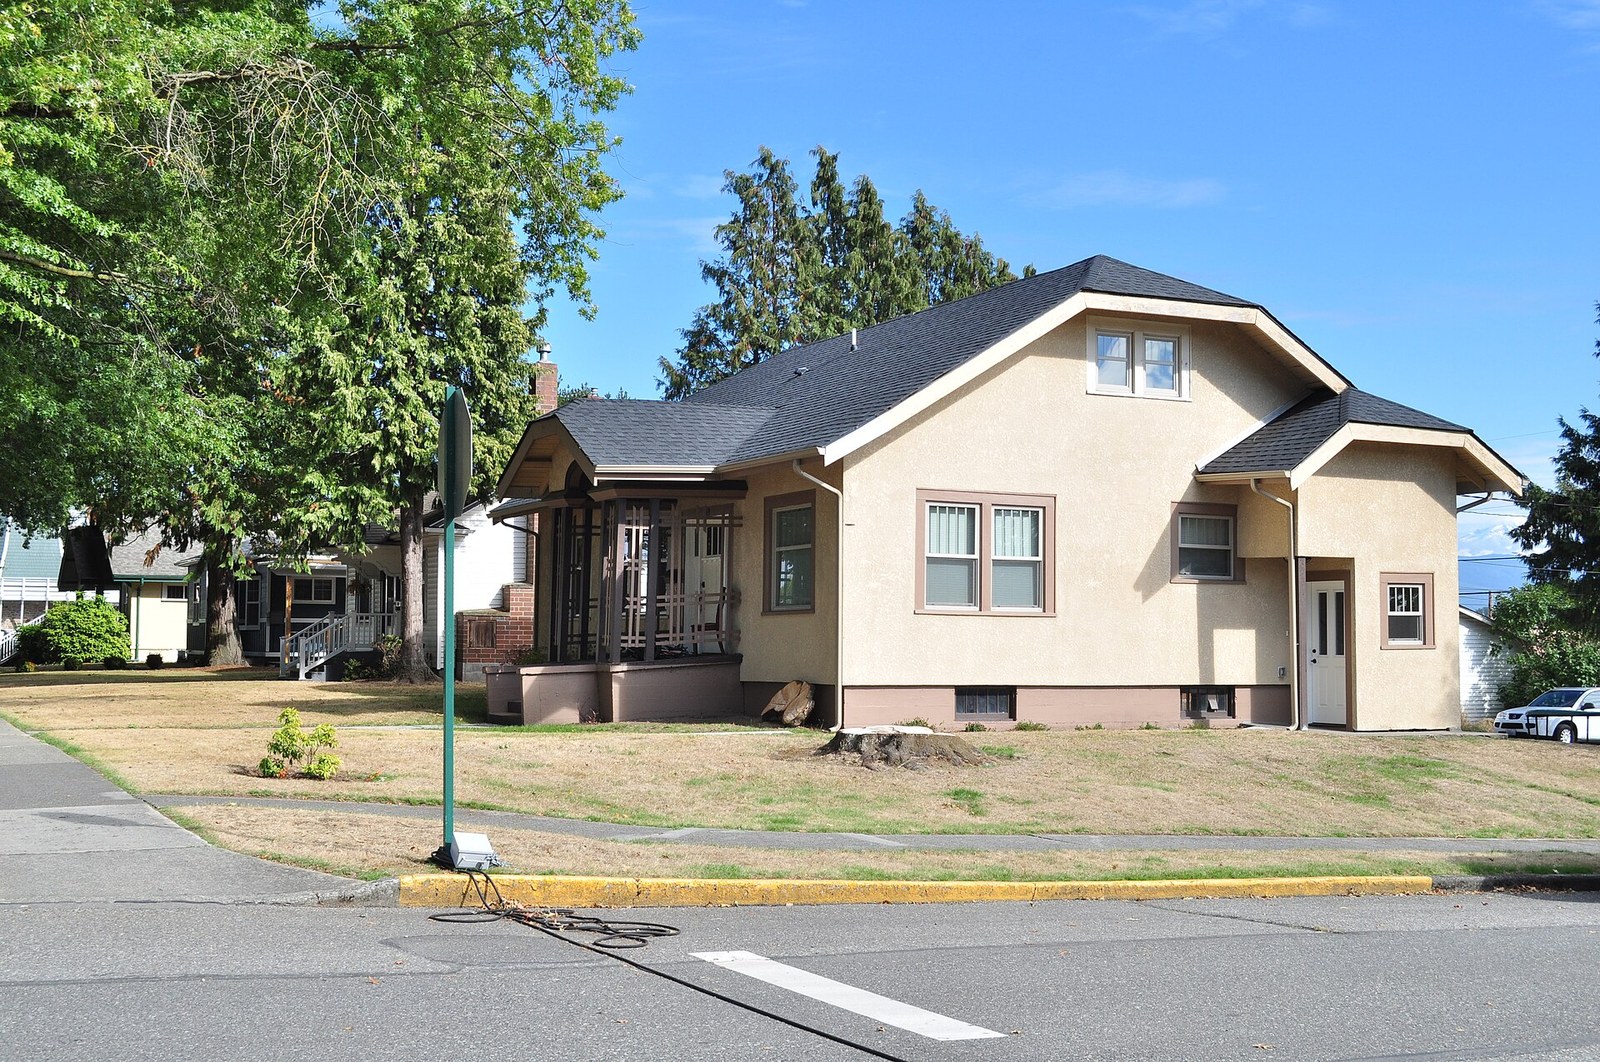 A home on Front Street in Lynden. Photo: Joe Mabel.
Time on Market: Plan for a Longer Runway
Homes and condos that closed in Lynden in September spent an average of 90 days on the market, compared with 55 days in September 2025 (Source: NWMLS). Months of inventory, which is roughly how long it would take to sell every active listing at the current pace, was 7.93 for homes and condos combined and 9.67 for single-family homes alone. That’s a lot of choice for buyers, and they know it.
Pricing: Why “Testing High” Backfires
It’s tempting to list high and leave room to negotiate. In this market, I see that strategy cost sellers. Lynden buyers have plenty of homes to compare, so an overpriced listing tends to sit while the well-priced ones get the showings. The longer a home sits, the more buyers wonder what’s wrong with it, and a price cut weeks later often lands below where the right price would have started. With the holidays coming, those lost weeks add up fast. I’d rather price for the market we actually have, using current comps instead of last year’s.
The Numbers: Look Past One Month’s Median
Here’s a caution I give every seller: only 9 single-family homes closed in Lynden in September, so one month’s median price can swing a lot depending on which homes happened to sell. I’d rather look at the bigger picture. From January through September, the median closed price in Lynden was $644,975 for single-family homes and $606,000 for homes and condos combined (Source: NWMLS). Even those come from a small-town sample, so I pair them with the active and pending listings closest to your home. If you want to see how Lynden stacks up against Ferndale, Blaine/Birch Bay and Everson, my North Whatcom Market Snapshot has the town-by-town picture.
 Good pricing starts with current comps, not last year’s.
Putting It All Together
Heading into the holidays, the Lynden sellers who do best launch at a price buyers recognize as fair, show the home at its best and plan for a little more time on the market. A longer runway isn’t a problem when you expect it.
Curious what your Lynden home would need to list competitively this fall? Reach out to me. I’ll pull current area comps for your neighborhood so we can set a price that works.
Source: NWMLS, Lynden, September 2026.